The AndPlus Innovation Lab is where our passion projects take place. Here, we explore promising technologies, cultivate new skills, put novel theories to the test and more — all on our time (not yours).

In order to reduce time wasted on failed jobs, AndPlus wanted to apply data science techniques and statistical learning knowledge to build a prediction model. This model should make a prediction whether this job is likely to fail or not when user submitted job through the website. Once the model identified one job as failure, the system will send the job in a different to minimize the impact on other jobs in this is a failure job. This prediction model will help the printer running more efficiently. AndPlus provided detailed data for both failed and successful job. The following is an example of the data structure of job.
Each job has one background (miscellaneous) layers which contains both width and height of banner and screen. The elements field contains data of images and text fields that users added. The number of image and text layers varies among jobs.
There were 3 stages to the research project.

In this project, we parsed the JSON files of over 10,000 print jobs into a structured format. The labs team then ran these jobs through a rigorous data pre-processing and handled all missing values. Once this process was complete, we had an initially high accuracy rate. Because the data was imbalanced, we want to model to focus on minimizing false positives and false negatives.
To further improve the models' performance on predicting failed jobs, we applied a resampling method. The table below compares four situations where we used only raw data, data with feature engineering without resampling, data with just resampling without feature engineering, preprocessed data with both methodologies by accuracy rate, N{V and recall rate indexes.
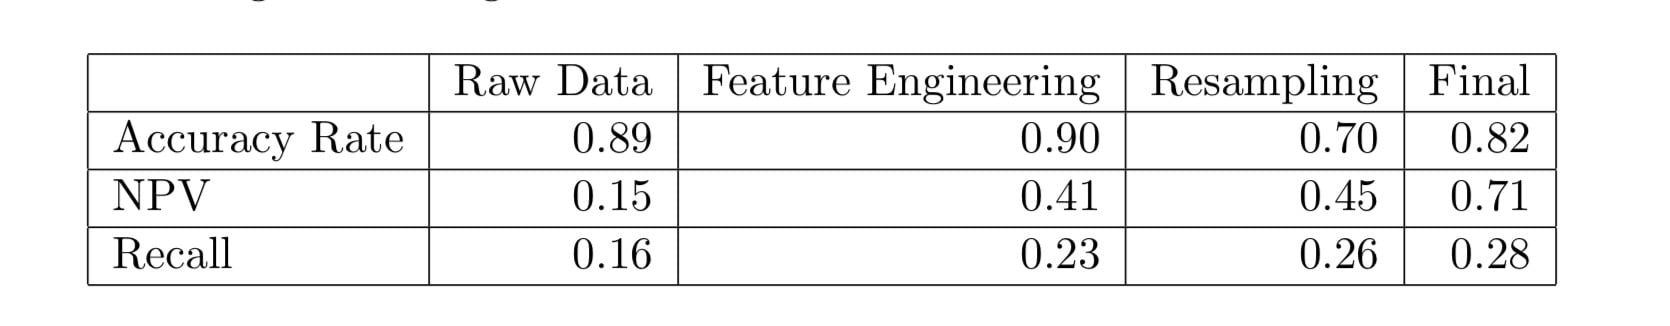
From the table above, we can see that our feature engineering and resampling methods have improved the models' performance greatly. So in following model training, we used data with feature engineering and resampling methods.
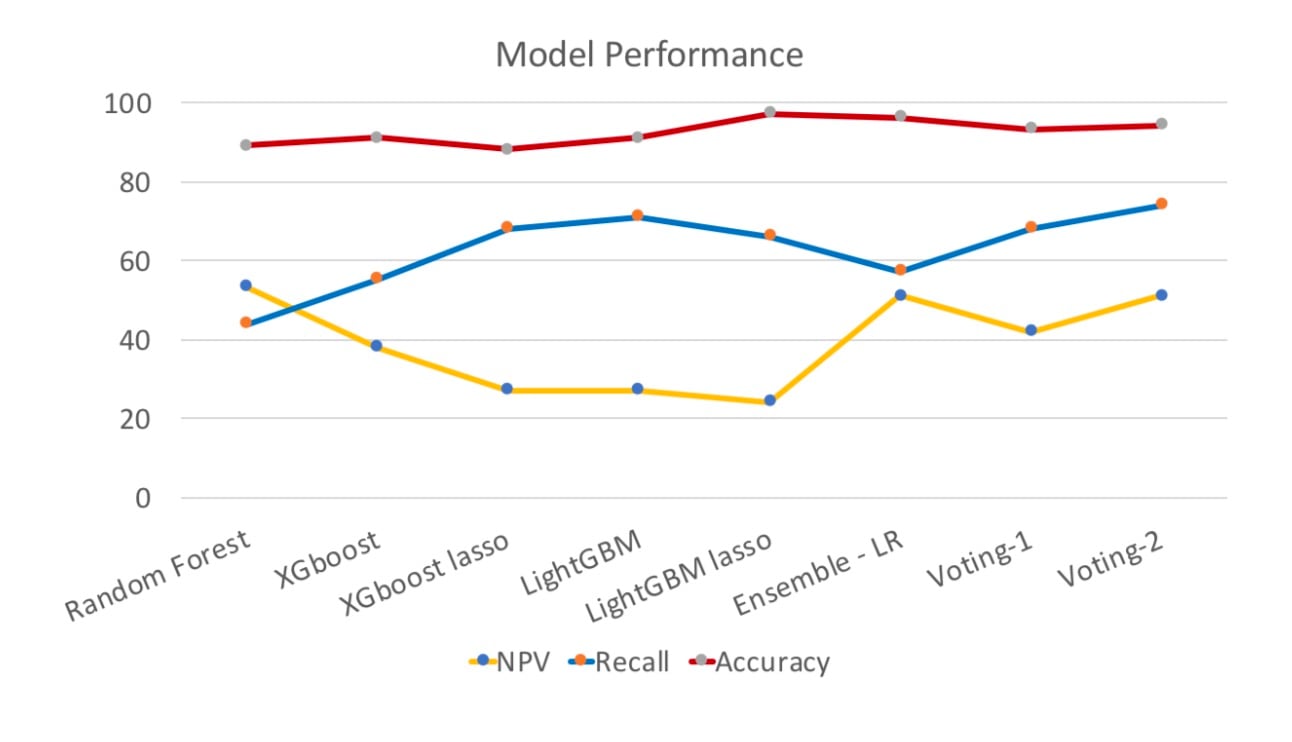
Among all the single models we picked the top three with highest overall performance on accuracy, recall and NPV rates. These were Random Forest, XGBoost and LightGBM. The chart above further compares results raised from the single models with and without lasso regression, along with three ensembling methods.
We can conclude that accuracy rate is at a high level. If we want to have a deeper look; the NPV value, Random Forest and Logistic Regression ensembling methods achieved a fairly good performance. Compared to the Ensemble-LR, random forest has sacrificed a lot in accuracy, and recall is 13% lower. Ensemble-LR returns the best result so far at 95%.